Theory A
Theory A is a financial intelligence platform that finds cheap convexity by visualizing dislocations between short-term traders extending Black-Scholes random walk assumptions into the future and long-term investors who care about underlying earnings & revenue.
Theory A is a financial intelligence platform that finds cheap convexity by visualizing dislocations between short-term traders extending Black-Scholes random walk assumptions into the future and long-term investors who care about underlying earnings & revenue.

Komi Count
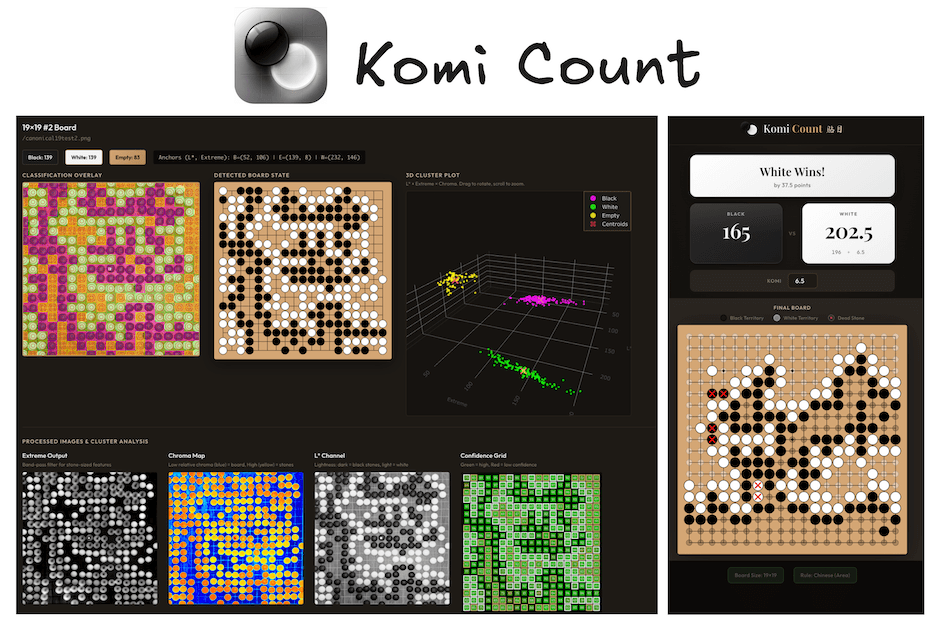
Komi Count is a fully local Go/Baduk/Weiqi image scorer that uses web assembly and local computer vision models to score games from an image.
Komi Count is a fully local Go/Baduk/Weiqi image scorer that uses web assembly and local computer vision models to score games from an image.
GloVe Galaxy
GloVe Galaxy is an interactive 3D visualization of GloVe word embeddings, letting you traverse the semantic geometry between words as constellations in vector space.
GloVe Galaxy is an interactive 3D visualization of GloVe word embeddings, letting you traverse the semantic geometry between words as constellations in vector space.

Neural Network Visualization
A visualization of 3blue1brown's video on MNIST neural network training.
A visualization of 3blue1brown's video on MNIST neural network training.

Cadence

World History
World History is an AI powered timeline creator that allows you to contextualize historical events. Below the events of World War II, chinese history, and the history of the Hermès brand and quantum mathematics are woven together.
World History is an AI powered timeline creator that allows you to contextualize historical events. Below the events of World War II, chinese history, and the history of the Hermès brand and quantum mathematics are woven together.

Option Chains
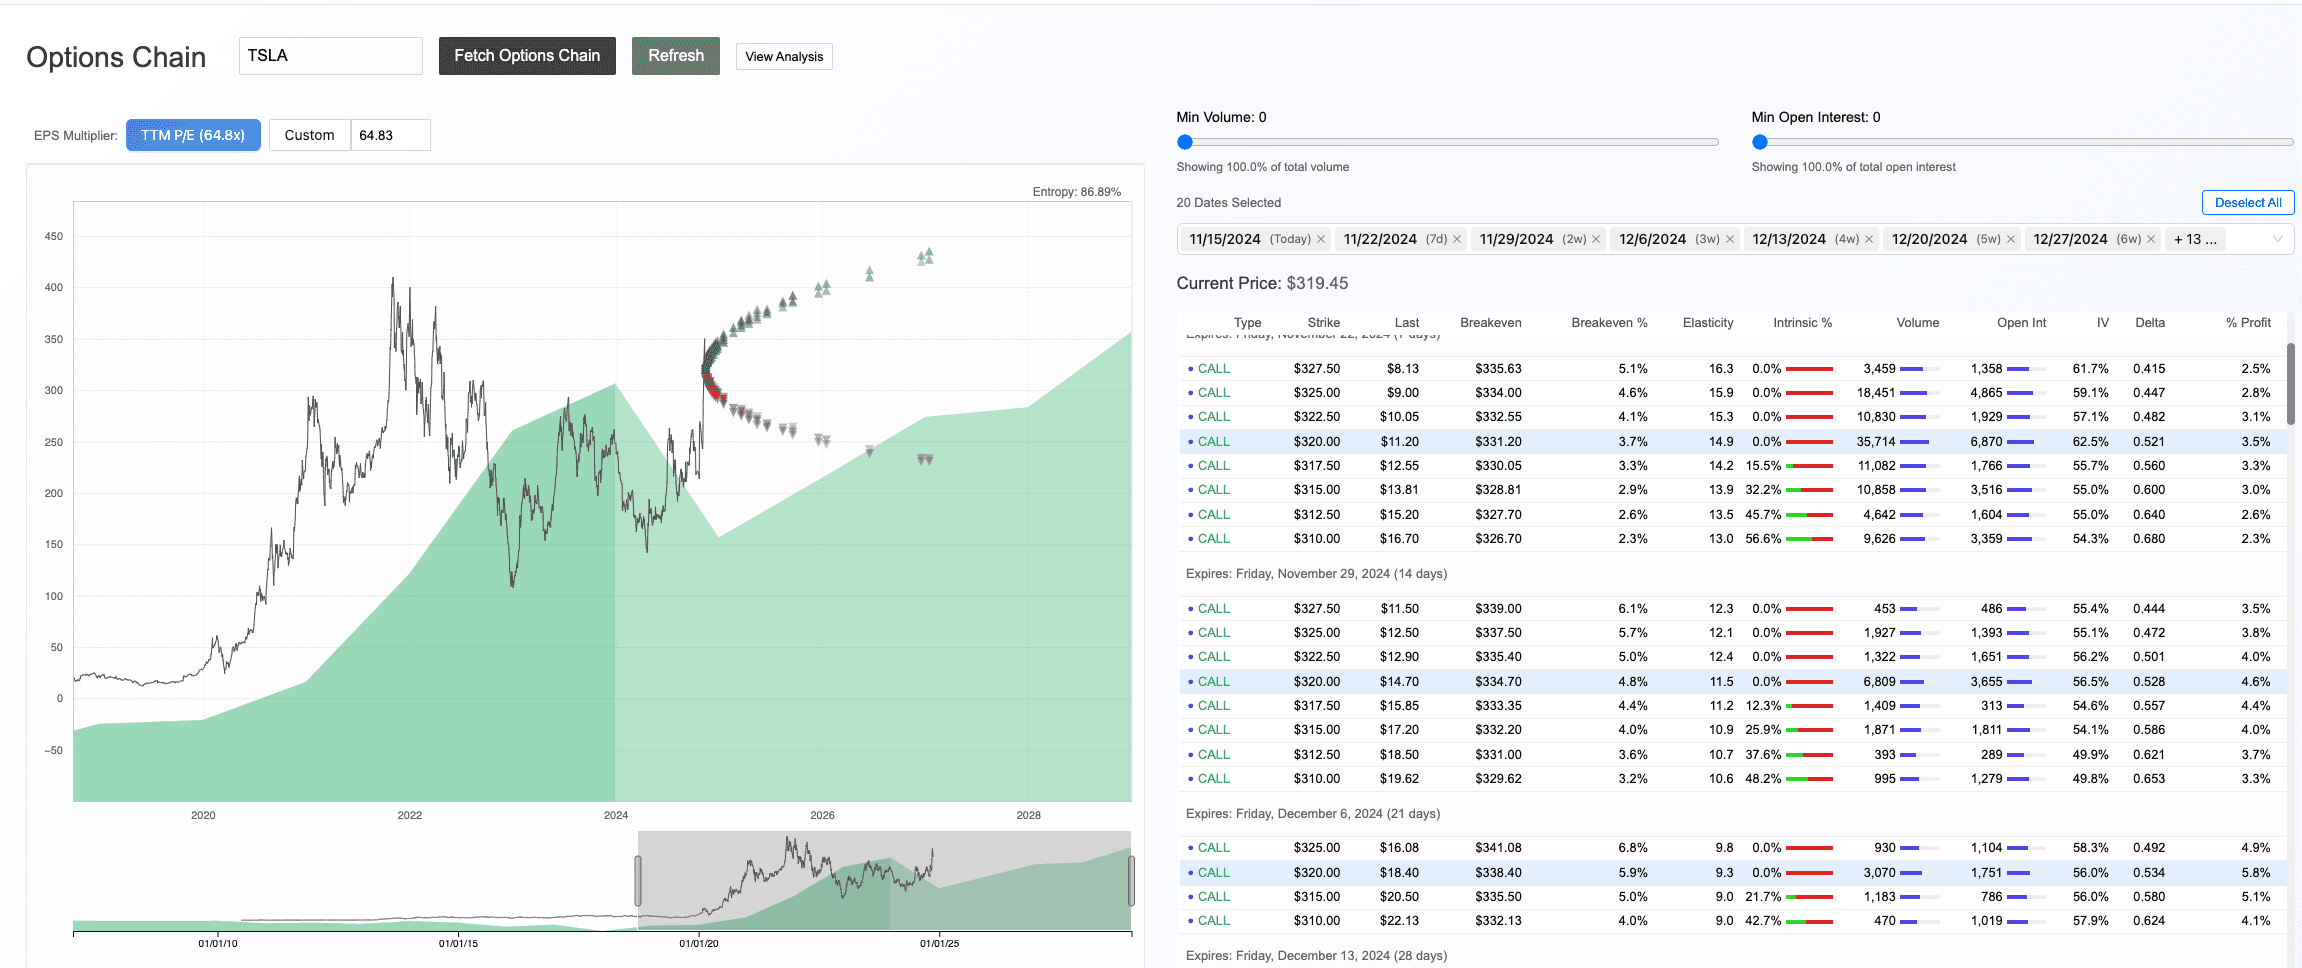
An option chain visualization tool that shows volatility and expected moves as inferred from trading activity. By plotting contracts at their breakeven points, the "cone" of expected moves can be visualized.
An option chain visualization tool that shows volatility and expected moves as inferred from trading activity. By plotting contracts at their breakeven points, the "cone" of expected moves can be visualized.
Meowmeow & Woofwoof
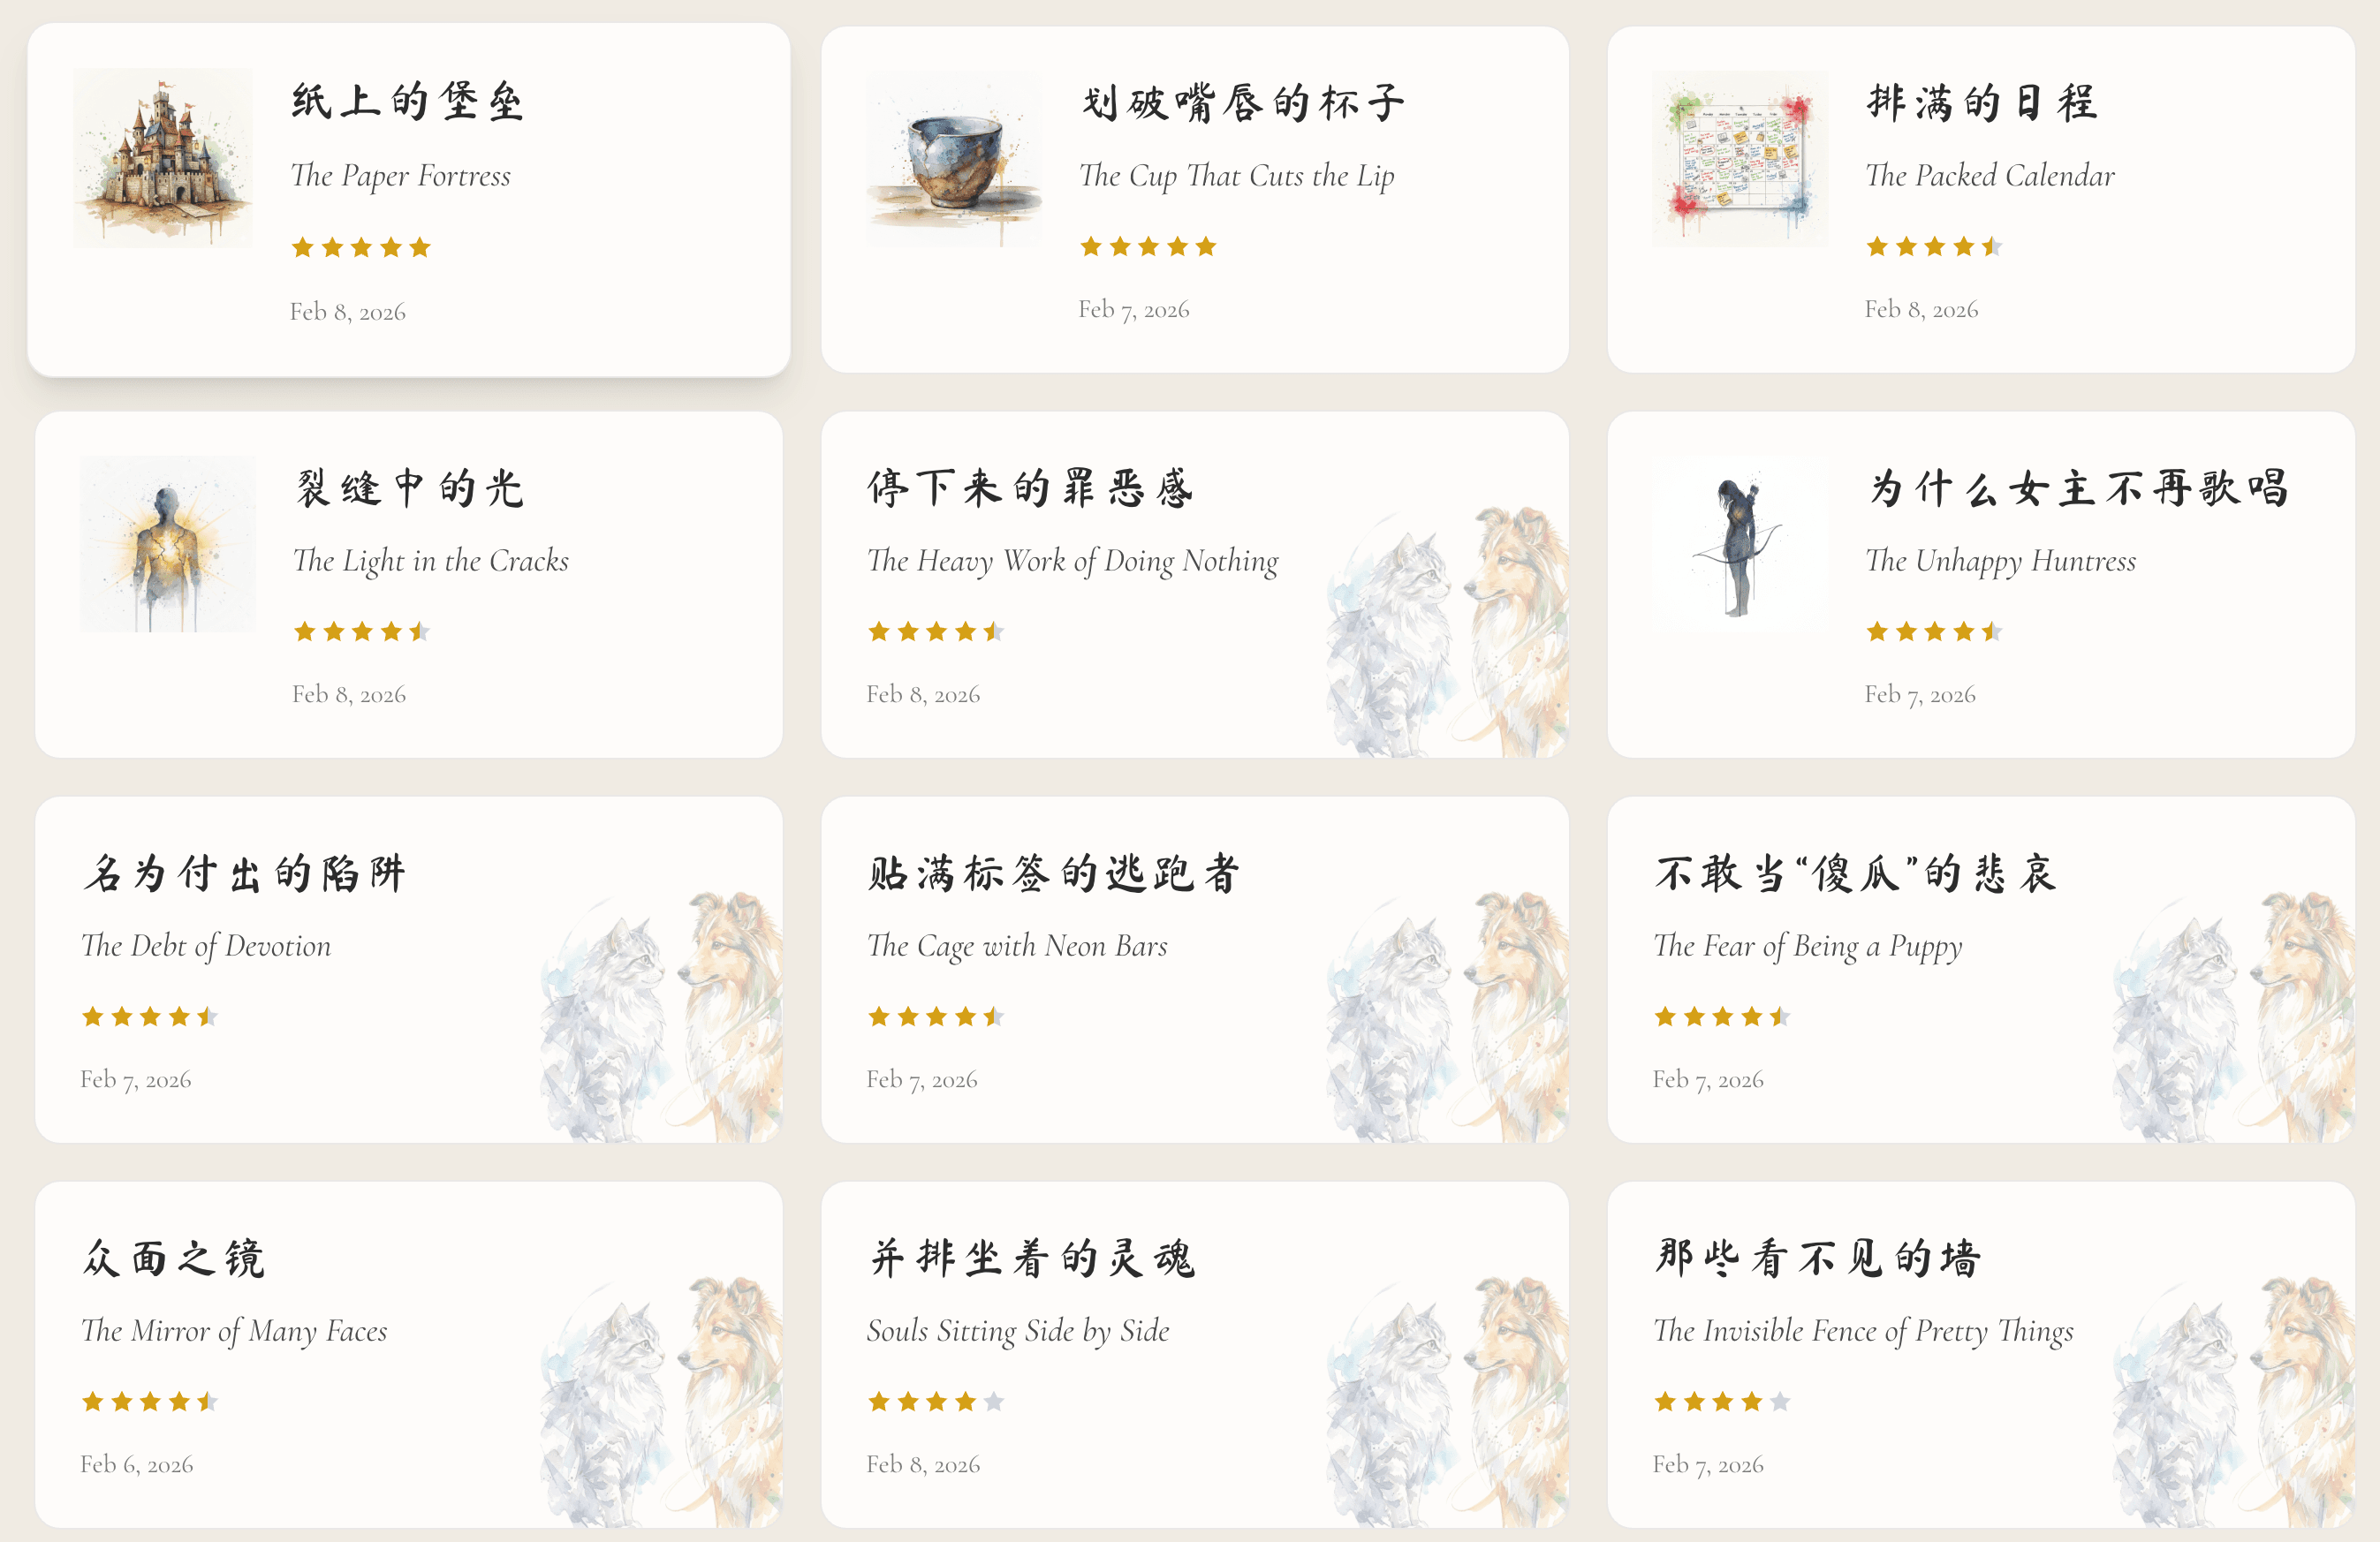
Meowmeow and Woofwoof is a chinese & english anthology of adult fables that deal with the anomie of "liquid modernity" presented as socratic dialogue between a dog and a cat.
Meowmeow and Woofwoof is a chinese & english anthology of adult fables that deal with the anomie of "liquid modernity" presented as socratic dialogue between a dog and a cat.
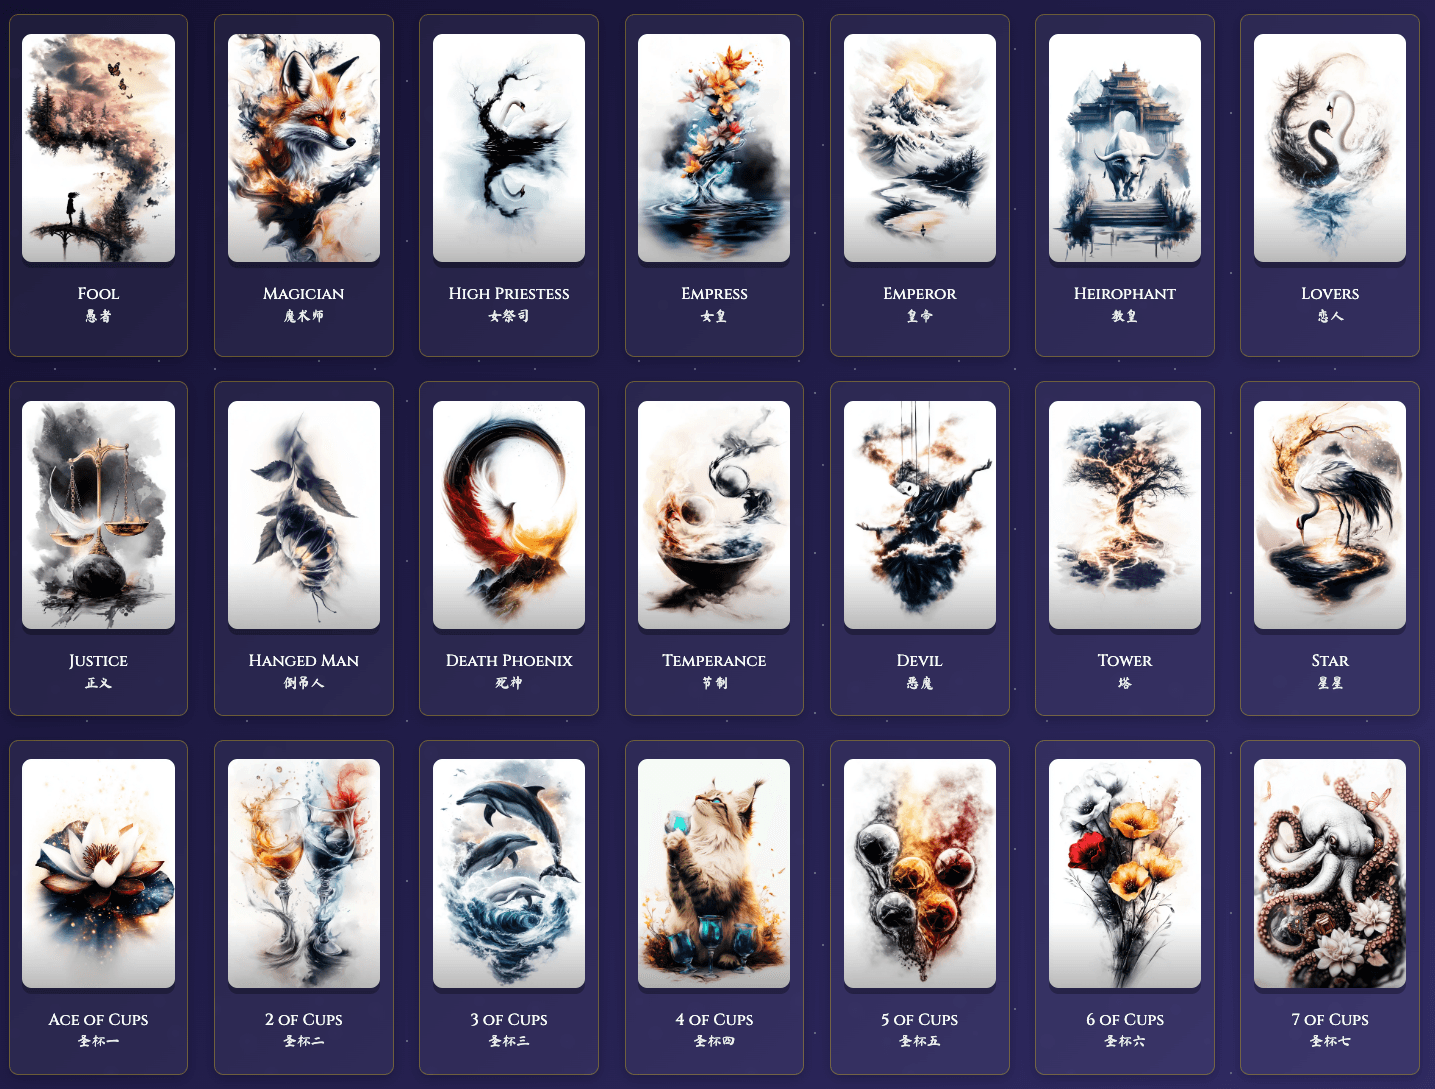
Yuan Ling Tarot
A custom created set of tarot cards embodying primal spirit archetypes.
A custom created set of tarot cards embodying primal spirit archetypes.
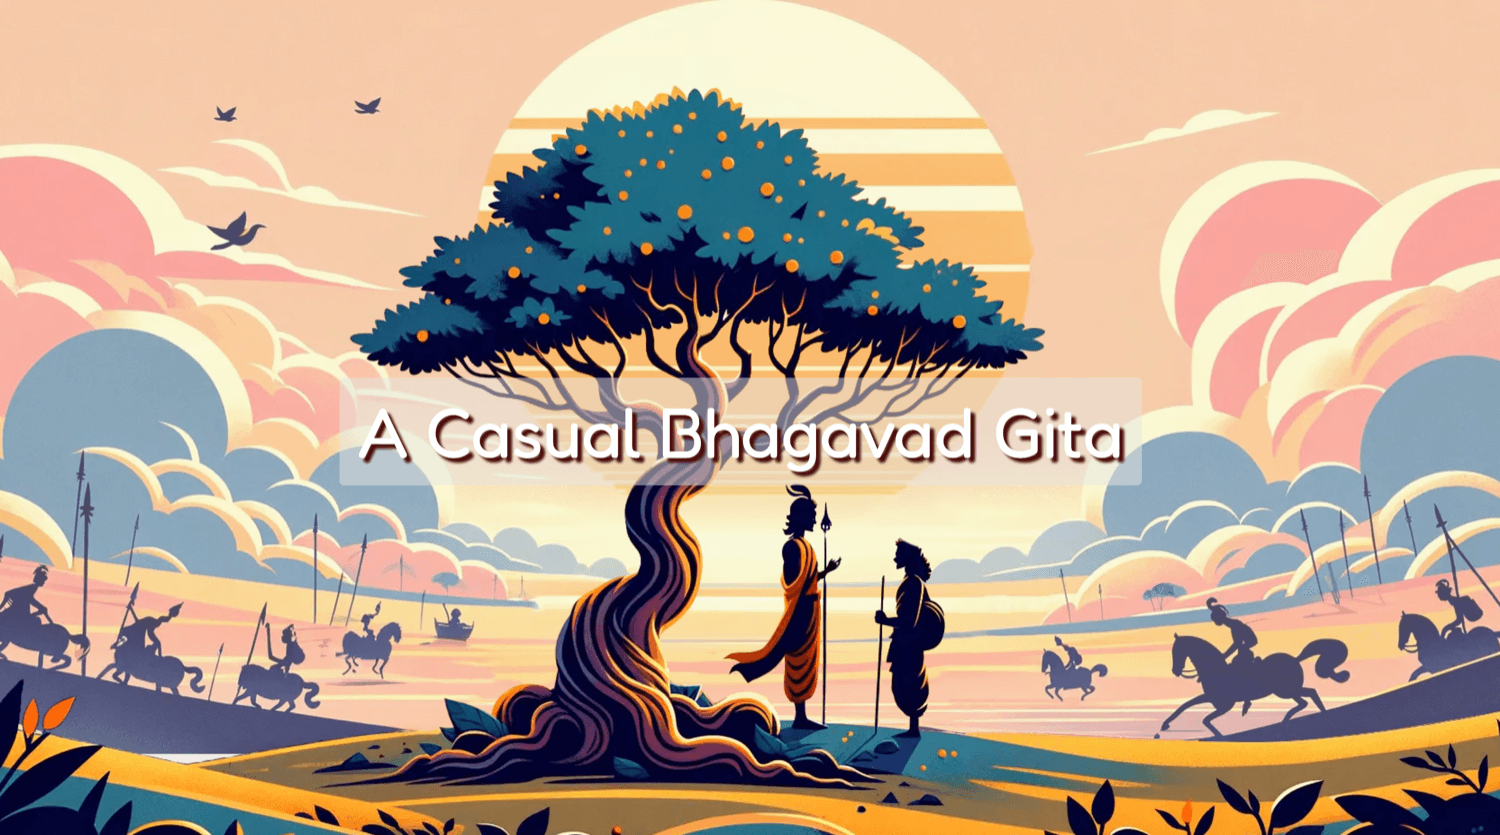
A Casual Gita
A Casual Bhagavad Gita is an expansion on the "A Casual Dao De Jing" project below. This one relies on LLM models a lot more since I don't know Hindi or Sanskrit at all so I can't proofread the results.
A Casual Bhagavad Gita is an expansion on the "A Casual Dao De Jing" project below. This one relies on LLM models a lot more since I don't know Hindi or Sanskrit at all so I can't proofread the results.
A Casual Dao De Jing
A Casual Dao De Jing is a more approachable and casual re-imagining of what is too often considered an esoteric and unapproachable text.
A Casual Dao De Jing is a more approachable and casual re-imagining of what is too often considered an esoteric and unapproachable text.

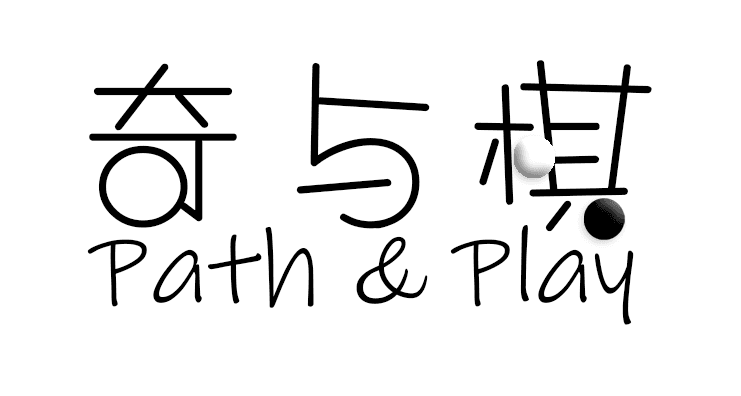
Path & Play
Path & Play is an ongoing series of interviews that bridges the gap of understanding between China and the West.
Path & Play is an ongoing series of interviews that bridges the gap of understanding between China and the West.
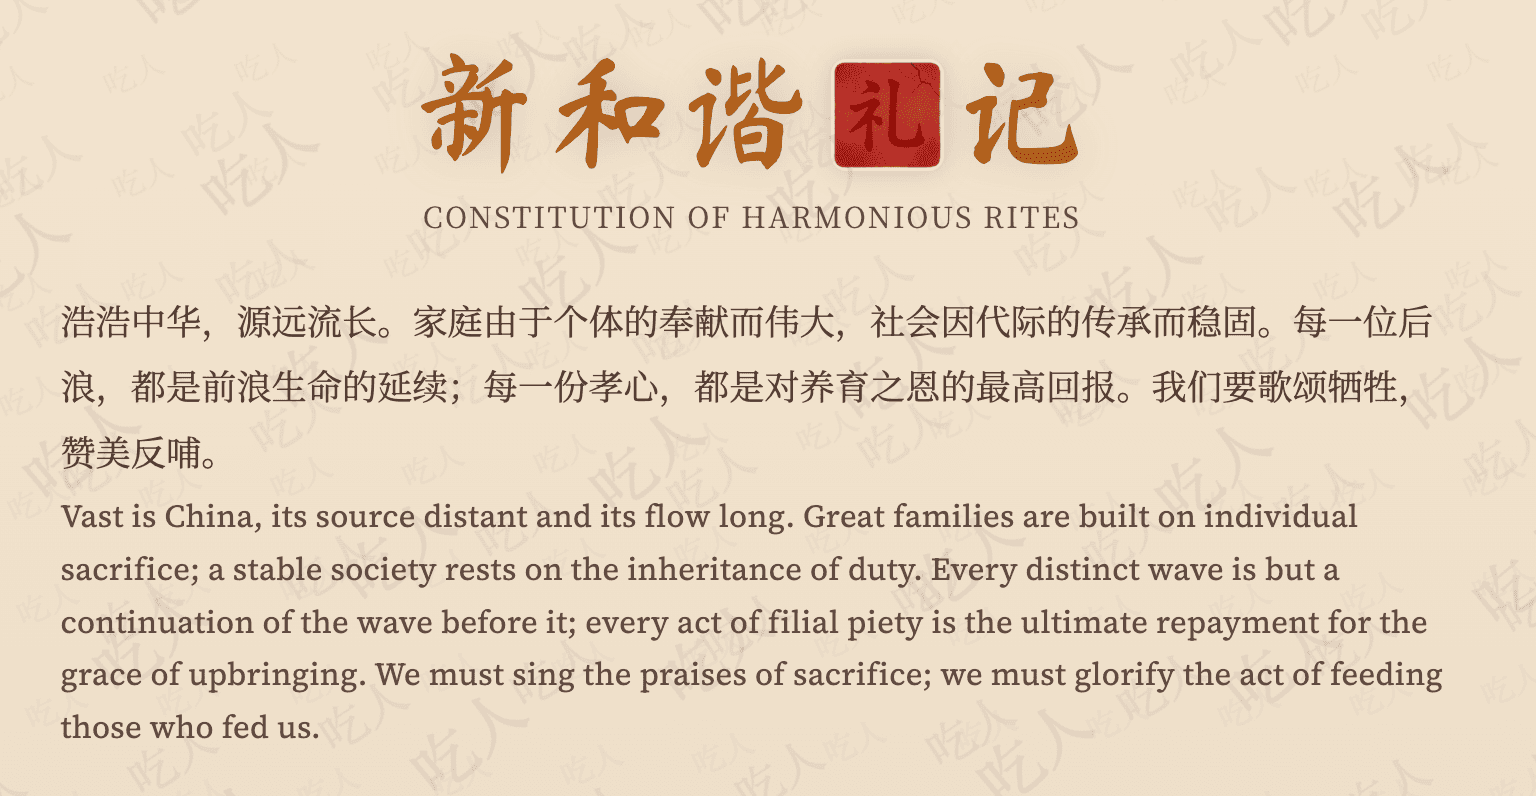
Harmonious Rites
"Constitution of Harmonious Rites" is a satirical throwback to the chinese writer Lu Xun, who criticized traditional confucian values as 吃人 or "cannibalistic" in nature, eating the spirit of the young to feed and perpetuate the system. Though his work was used to fan the flames of revolution in the 1920s the societal prevalence of 吃人 can be said to be even higher today despite increased absolute material wealth.
"Constitution of Harmonious Rites" is a satirical throwback to the chinese writer Lu Xun, who criticized traditional confucian values as 吃人 or "cannibalistic" in nature, eating the spirit of the young to feed and perpetuate the system. Though his work was used to fan the flames of revolution in the 1920s the societal prevalence of 吃人 can be said to be even higher today despite increased absolute material wealth.
Kelly Game Criterion

Bayes Impact
As part of a team of 5 that won the grand prize, I created the visualization tool for the 2014 Bayes Impact Hackathon that aimed to discover hidden prostitution rings and help prevent child sex trafficking.
As part of a team of 5 that won the grand prize, I created the visualization tool for the 2014 Bayes Impact Hackathon that aimed to discover hidden prostitution rings and help prevent child sex trafficking.